Hello guys,
When I open an Animation Curves, after I created a Transform Mask, I don’t see
opacity and rest lines into Animation Curves.
I also don’t see any way to add a keyframe.
How can I start using animation curves without problems?
Thank you.
Hello guys,
When I open an Animation Curves, after I created a Transform Mask, I don’t see
opacity and rest lines into Animation Curves.
I also don’t see any way to add a keyframe.
How can I start using animation curves without problems?
Thank you.
Hello @Humin-Mumin and welcome to the forum ![]()
The Opacity curve will be available if you select the paint layer.
If you select the transform mask then you’ll have the transform parameter curves.
You can add an animation curves keyframe with the ‘+’ (and subtract with the ‘-’) icon at the top of the Animation Curves docker.
You won’t see any parameter names until you add a keyframe.
It’s important to add a keyframe at frame-0 to avoid problems later on.
Please see this reply which deals with transform Shear values but is generally applicable:
Add Shear keyframe on Animation Curves - #2 by AhabGreybeard
Thank you about your comment.
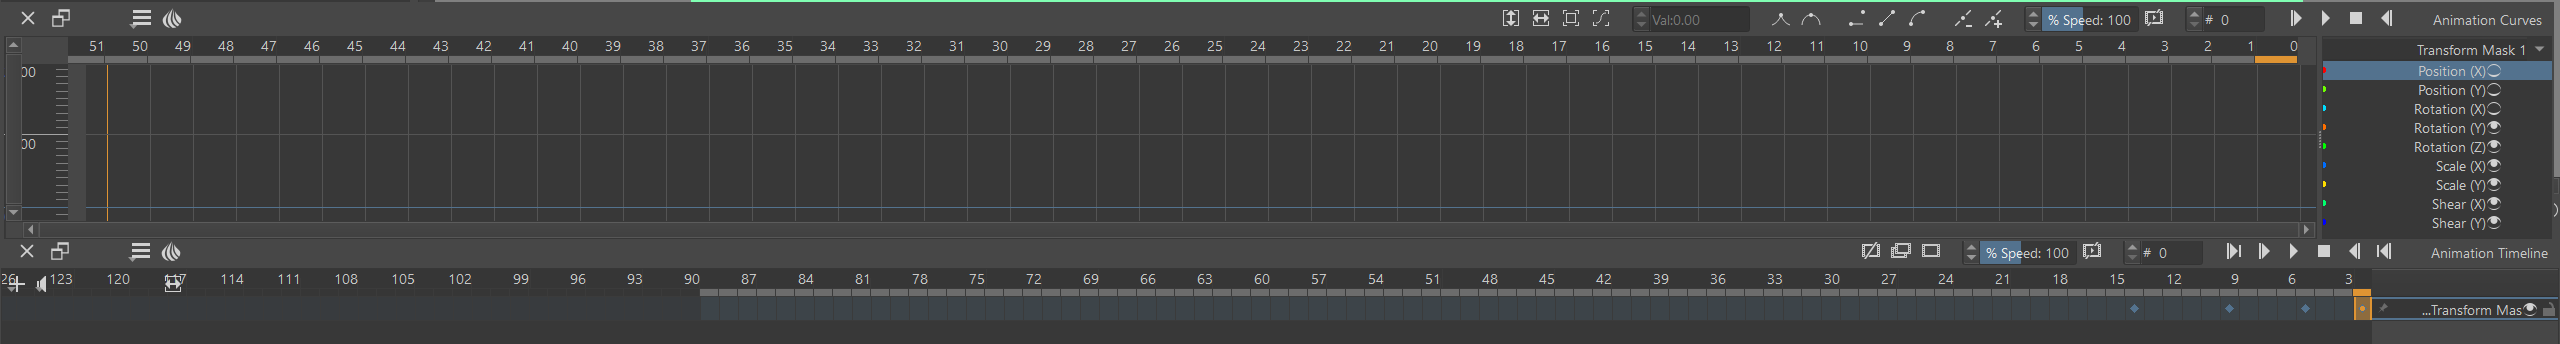
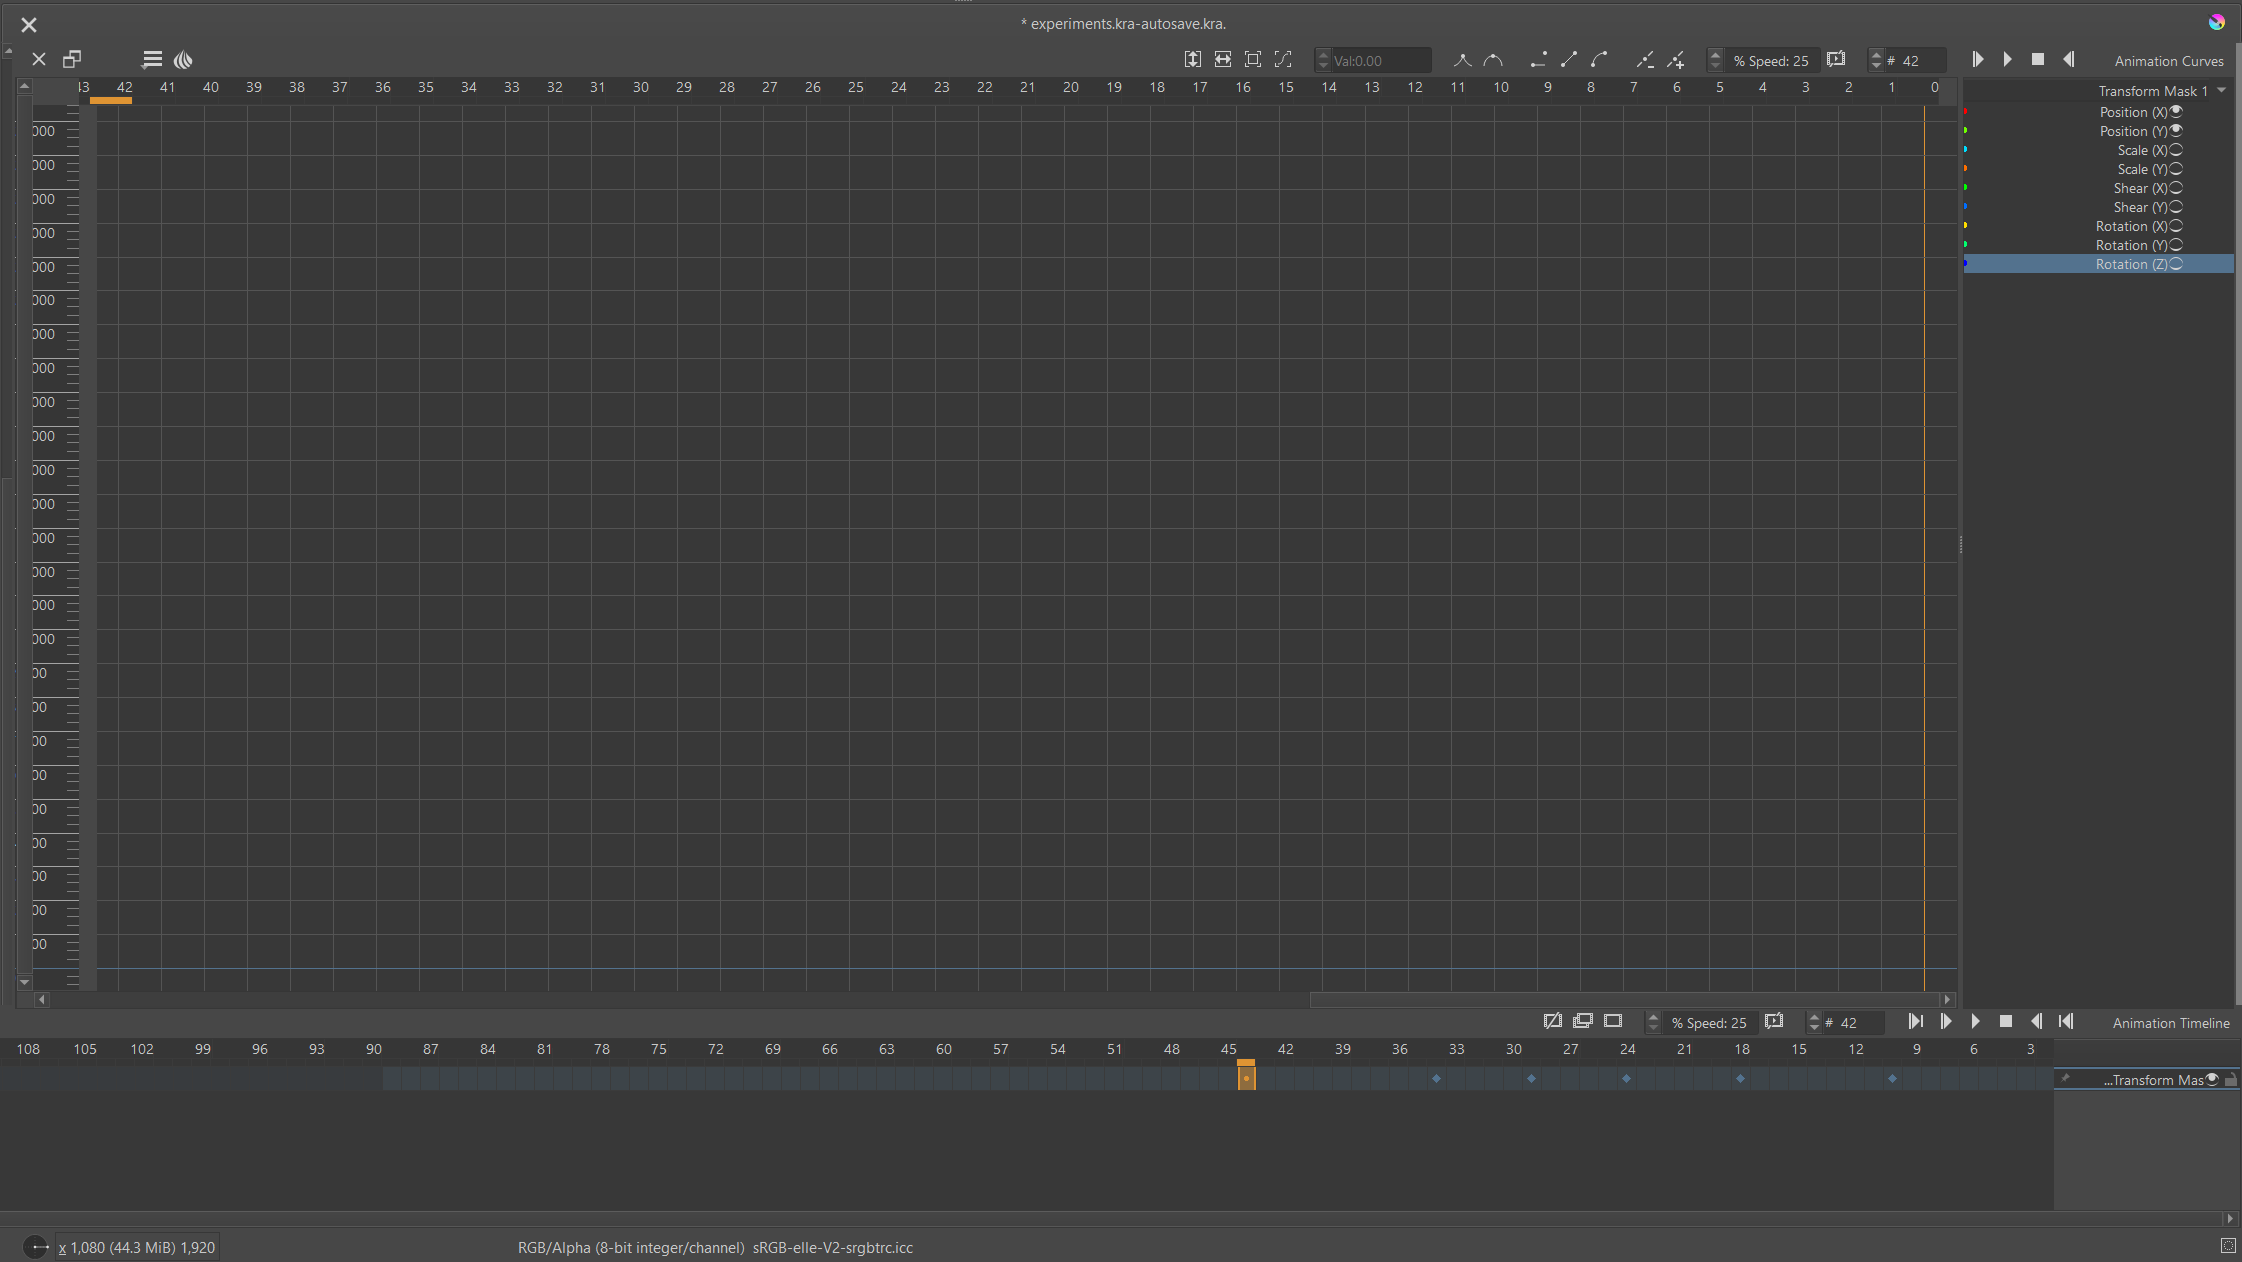
I don’t see any parameter at all after I choose transform mask, no metter what I do.
Take at look:
Which version of krita and which operating system are you using?
The list of transform parameters is on the right.
What you don’t have visible are any keyframes in the Curves docker.
Are you using a Right to Left Language? I’ve never seen that arrangement of the Timeline and Curves docker before.
What happens if you click the ‘+’ icon on the top row of the curves docker after selecting frame-8 along the top row frame indicator?
It’s a good idea to turn off the visibility of the parameters that you’re not interested in.
The scale on the left is very narrow, can you drag it out to the right.
Can you drag the parameter list section out to the left a little?
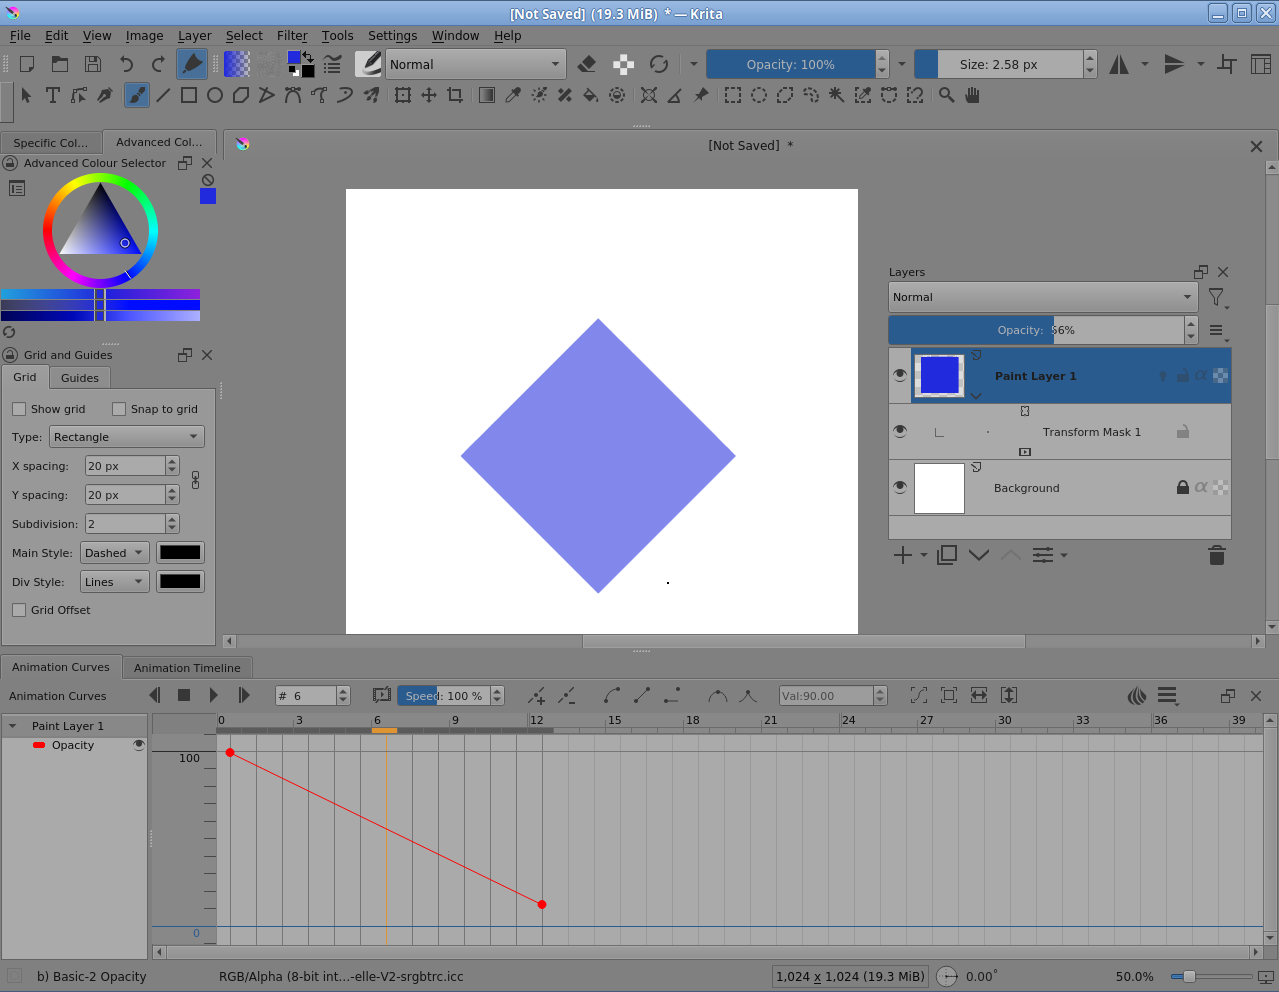
You can make the Timeline and Curves docker share a tabbed space if vertical screen space is a problem. Here is the paint layer selected so that the Opacity curve is shown:
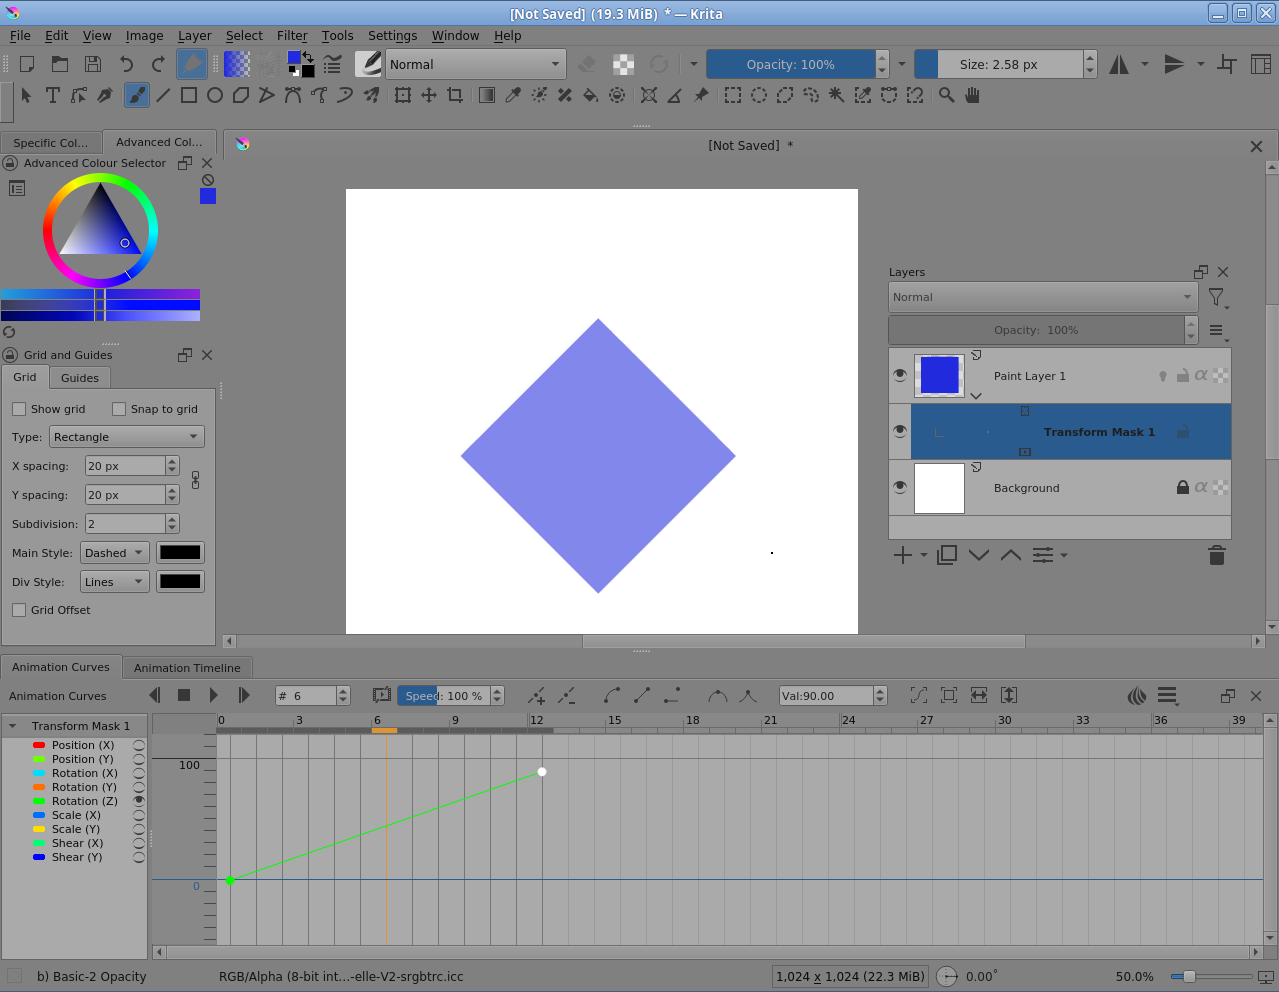
Here is the Transform Mask selected so that the transform parameters are shown with only the Rot(Z) parameter curve visible:
Here are all transform parameter curves visble and the left scale has auto-adjusted after the Curves docker was re-selected:
You can click-drag the scale up and down to adjust it.
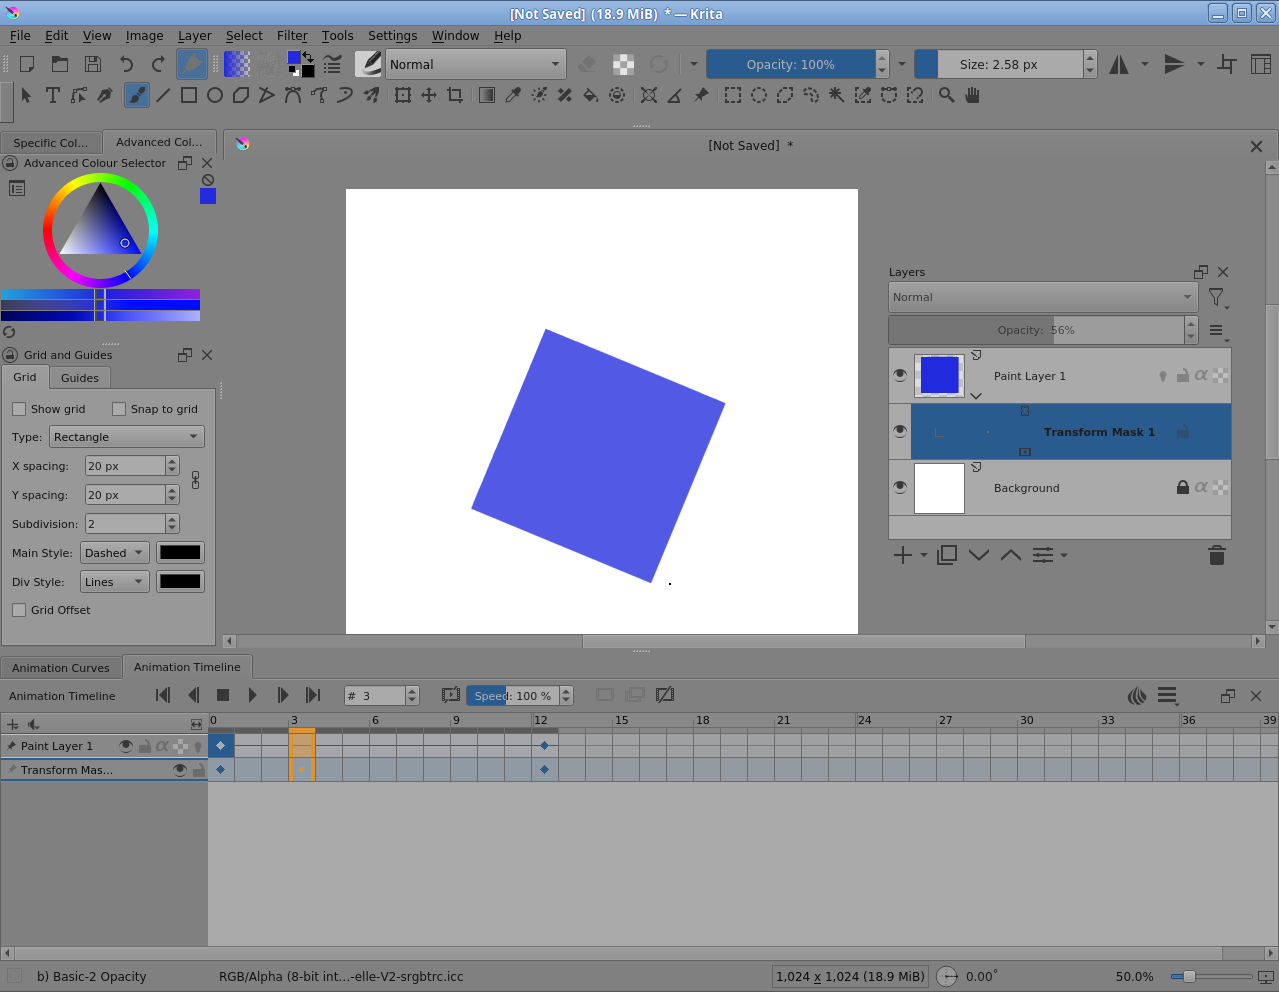
Finally, the Timeline:
All keyframes were made by selecting the frame, either on the Timeline or by using the frame indicator at the top of the Curves docker, then clicking the ‘+’ icon.
Here is the resulting animation rendered out:
The Animation Curves docker does have some user interface and user experience shortfalls but those are being worked on, along with other ‘less than perfect’ aspects of animation. It does work though.
So, I’m puzzled as to why your Curves docker is not showing keyframes with coloured lines between therm.
Can you try to replicate the simple animation that I’ve demonstrated (on a static image) to see where the problem may come from?
Edit:Add: Please show full screen screenshots that include the status bar along the bottom and the Layers docker.
Thank you for the thoughtful response.
Version krita-x64-5.1.5
I installed Krita with English version, but my windows 10 is Hebrew version (right to left)
After I click on “+”, transform parameters is sppear in right window, but without any keyframe.
Even after I move the object between the frames and create an animation that works.
Beizer, Linear interpolation, Hold, Smooth and sharp buttons doesn’t work as I understand.
No diffrent after I turn off the irrelevant parameters.
I can’t change the scale on the left. Maybe something intresting in “view”? I didn’t found.
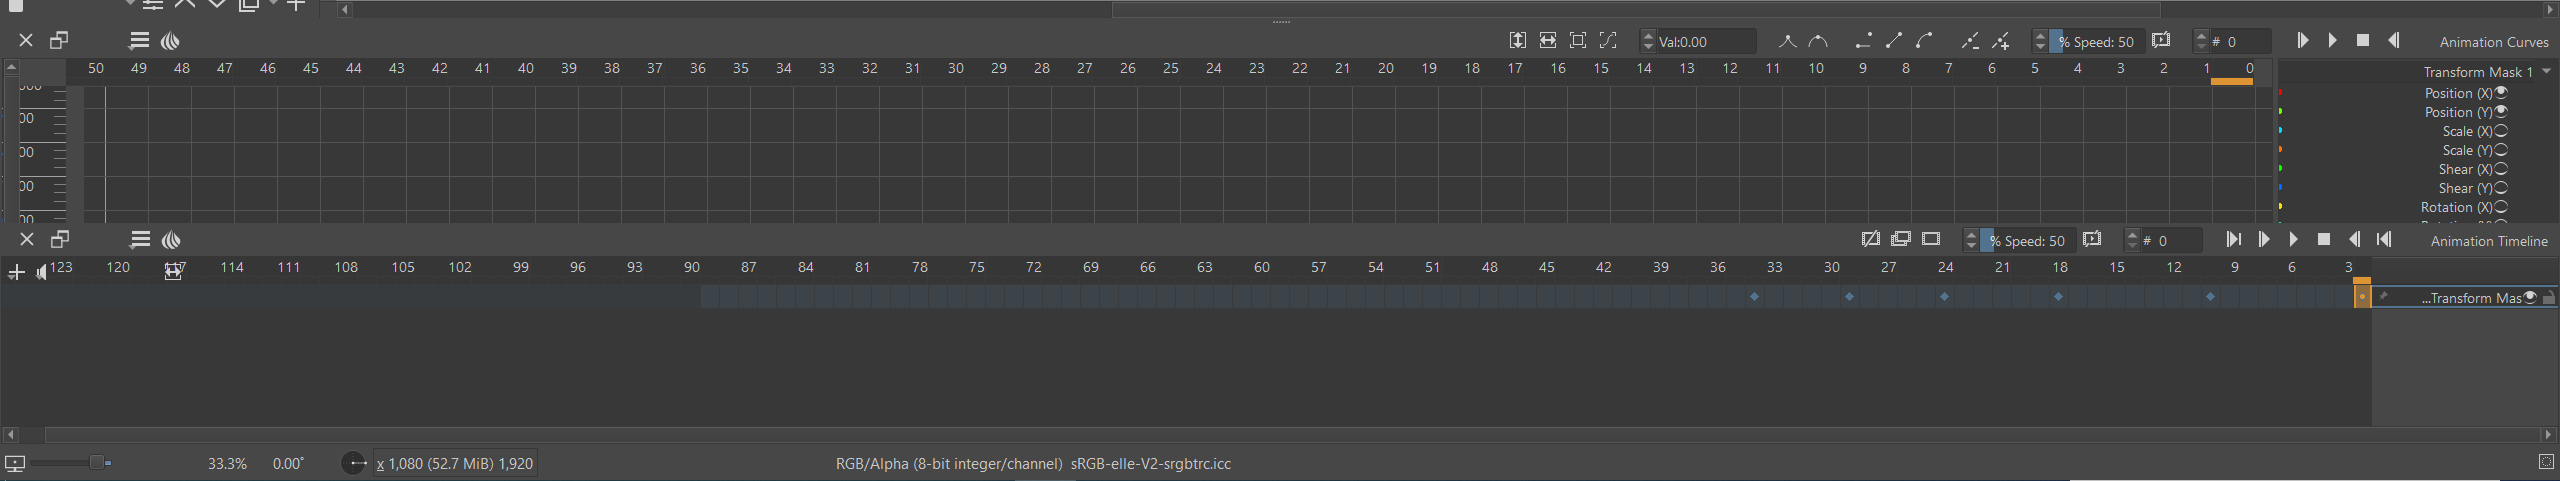
I draged the parameter list section a litle bit to the left.
About to share, something like this?
The use of an RTL language is badly affecting the layout of the Animation Curves docker.
That is a separate issue that can be reported elsewhere.
Your screenshot where only the Position(X,Y) parameters are enabled has a fine blue horizontal line at the bottom. I think that’s the zero value marker.
It’s impossible to tell what the numbers are on the left side scale but the scale can be changed by click-dragging up/down in the scale area (a coarse control) or by click-dragging the double headed vertical arrow at the top of the Curves docker (a fine control).
If you hover over the curves docker grid area, mouse wheel scrolling will give fine offset control.
Can you try adjusting the numerical scale by click-dragging down inside it to compress it. That should bring in any curves for values that are too large to be seen.
As a different test, please download and open the blue square animation that I made and illustrated before. The direct download link is here:
rotate opacity square.kra
The Animation Curves of this are known values and they do exist as we’ve seen.
So can you see those curves in your Animation Curves docker if you manipulate the vertical values scale and offset.
Also, can you see the Opacity curve by selecting the paint layer?
Thanks for all your help. I changed the language settings in Windows to English and the problem was solved ![]()
I’m glad that you’ve found a way to get it working for yourself so ![]()
It seems that the use of a RTL language orientation is not just a cosmetic arrangement problem with the docker.
Please create a topic in the Artists Feedback and Testing category saying that RTL (specifically Hebrew) causes bad layout and non-functionality in the Animation Curves docker.
You can include a link back to this topic to give more information.
This topic was automatically closed 30 days after the last reply. New replies are no longer allowed.